how to draw a probability tree diagram in excel
A diagram that is used to provide a visual depiction of the possibilities and outcomes of an event is called a probability tree diagram. Using Microsoft Excel, we can easily do such work. In this article, we are going to demonstrate 3 handy ways to make a probability tree diagram in Excel. If you are also curious about it, download our practice workbook and follow us.
Download Practice Workbook
Download this practice workbook for practice while you are reading this article.
Overview of Probability Tree
A diagram that is used to provide a visual depiction of the possibilities and outcomes of an event is called a probability tree diagram. The nodes and branches make up the two components of the tree diagram. An event is represented by a node. A branch is a visual representation of the relationship between an event and its result.
For example, we can consider a coin that has two sides: a head and a tail. If we toss the coin, it can either come head or tail. The probability of getting anyone will be 0.5 or 50%. Now, if we show this scenario in the probability diagram tree, that will be like the image shown below:

3 Easy Ways to Make a Probability Tree Diagram in Excel
To demonstrate the approaches, we take a coin and toss it twice. As a result, we get the four combinations of the events that can occur during the toss. We show the possible events in the range of cells C5:D6.

📚 Note:
All the operations of this article are accomplished by using Microsoft Office 365 application.
1. Using SmartArt Option to Create a Probability Tree Diagram
In this method, we are going to use the SmartArt option to make a probability tree diagram in Excel. The steps of this process are given below:
📌 Steps:
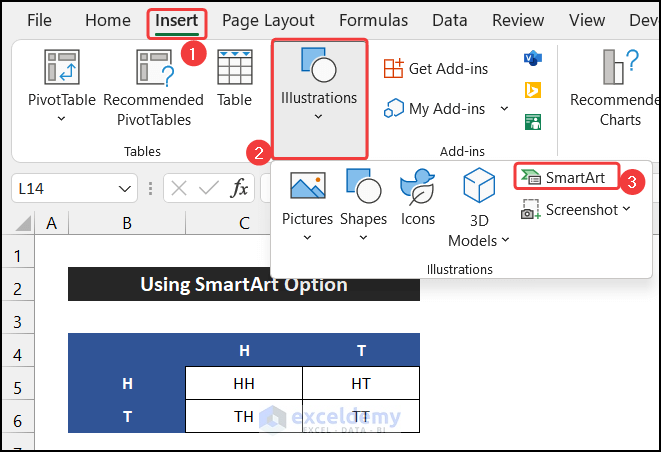
- First of all, go to the Insert tab.
- Now, click on the drop-down arrow of the Illustration and choose the SmartArt option.
- As a result, a small dialog box called Choose a SmartArt Graphic will appear.
- Then, from the Hierarchy tab, choose a chat according to your desire. We choose the Horizontal Organization Chart.
- Finally, click OK.

- The chart will appear on the spreadsheet.

- Here, when we toss the coin first time, we will get either head or tail. So, format the chart as two possible events that can come from an event.

- After that, from each event, we will get two more events.
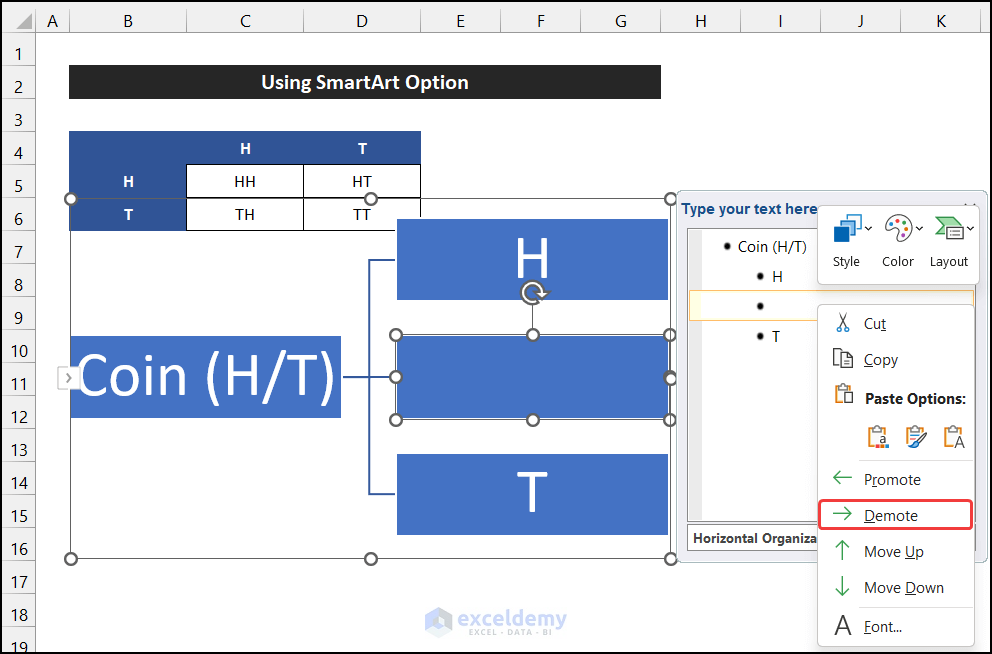
- To insert them, click on the right arrow on the right side of the chart.
- As a result, a small side window will appear,

- Now, press Enter to add another point after H or head.
- Then, right-click on the point and select the Demote option to create the section from the second toss.
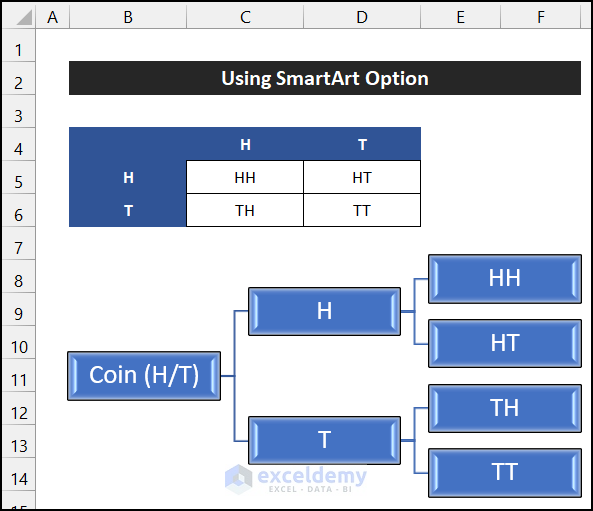
- Afterward, write down the possible events in those boxes.

- Similarly, create another secondary section for the T or tail.

- At last, format the diagram according to your desire.
- Our probability tree is ready.
Thus, we can say that our procedure works perfectly, and we are able to make a probability tree diagram in Excel.
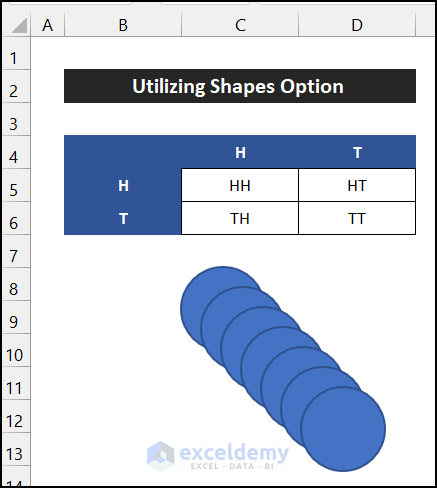
2. Make a Probability Tree Diagram Utilizing the Shapes Option from Insert Tab
In this process, we will use the Shapes to make a probability tree diagram in Excel. The procedure of this process is described below step-by-step:
📌 Steps:
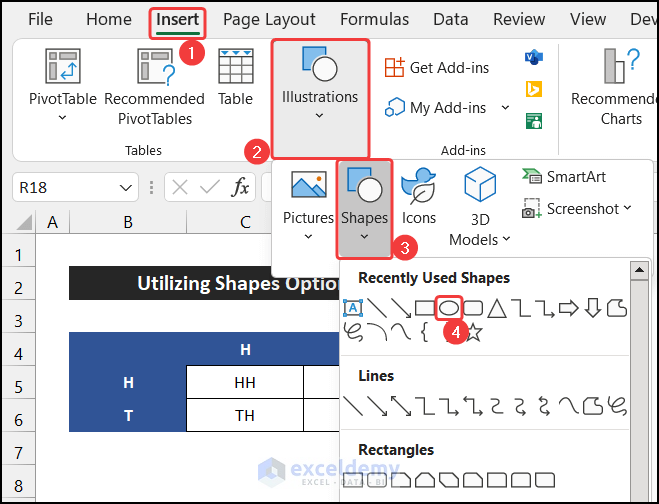
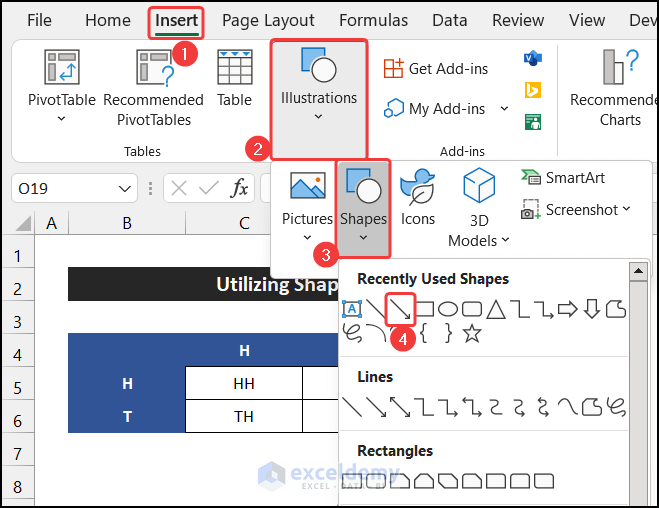
- First, in the Insert tab, click on the drop-down arrow of the Illustration > Shapes option.
- Then, click on a shape according to your desire. Here, we choose the Oval shape.
- You will notice that your mouse cursor look will change.
- Now, click on the empty place and drag the mouse to get the shape.
- Then, resize the shape according to your need.

- We know that in the first toss, we can get two identical events, and after the second toss, the number of events will go to four.
- So, press 'Ctrl+D' six times to create a similar type of oval 6 times. These ovals are the nodes of the probability tree diagram.
- After that, rearrange them into 1, 2, and 4 in order and write down the following events.

- Now, we have to insert the branch. For that, again, go to the Insert tab.
- Then, click on the drop-down arrow of the Illustration > Shapes option and choose the Line Arrow shape.
- Insert the Line Arrow shape as we insert the Oval shape.

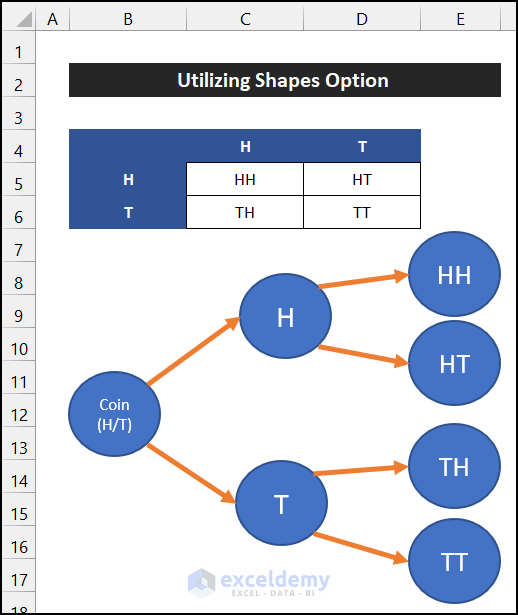
- At last, place the arrow to make a relation among the nodes like in the image shown below.

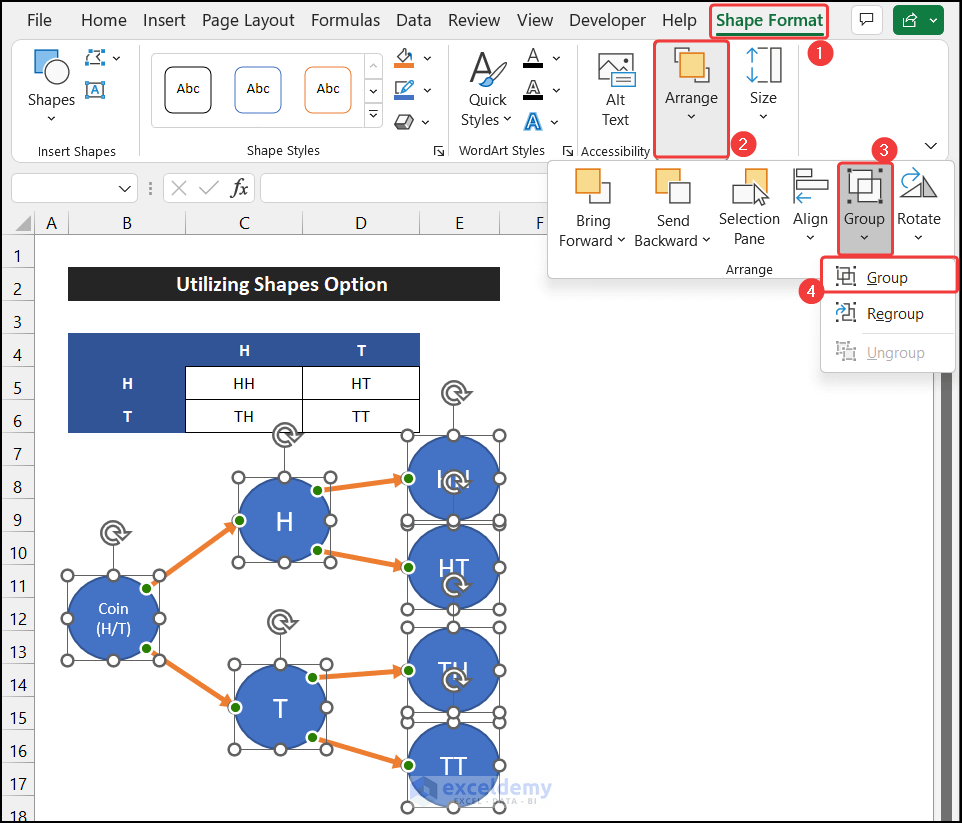
- Finally, format them according to your desire. Moreover, select all the shapes and click on the drop-downarrow of the Group > Group option from the Arrange group, located in the Shape Format tab, to stop their accidental movement.
- Our probability tree diagram is ready.
Hence, we can say that our approach works effectively, and we are able to make a probability tree diagram in Excel.
3. Applying the Text Box Feature to Make a Probability Tree Diagram
In the last approach, we are going to use the Text Box of Excel to make a probability tree diagram in Excel. The steps of this procedure are given as follows:
📌 Steps:
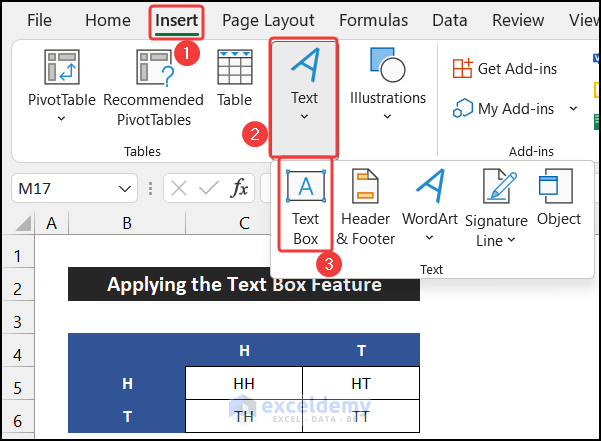
- At first, in the Insert tab, click on the drop-down arrow of the Text command and choose the Text Box option.
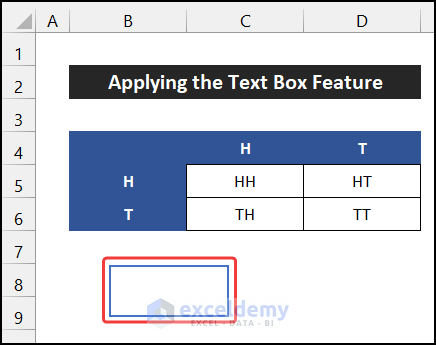
- You will see that your mouse cursor look will change.
- After that, click on the empty place and drag the mouse to get the text box.
- The box will appear on the sheet.
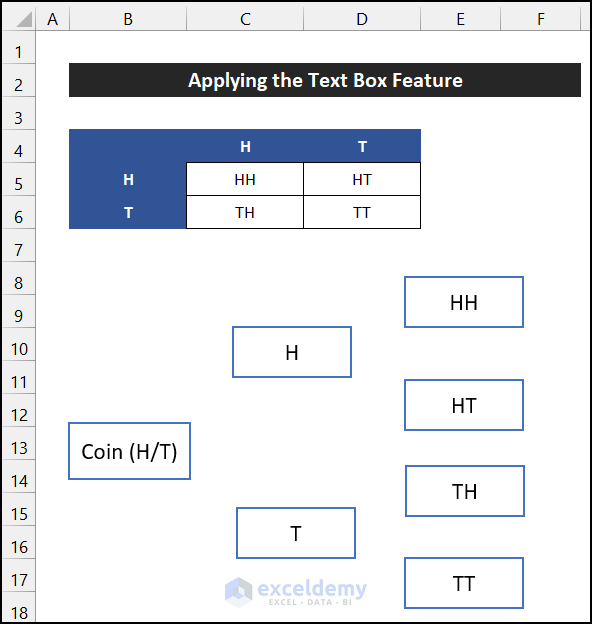
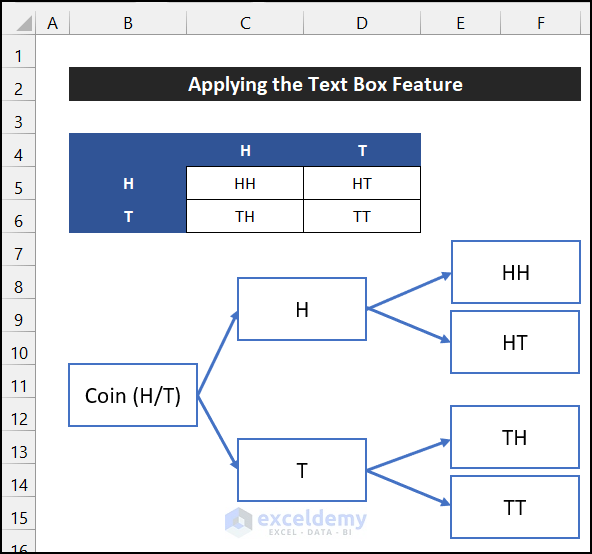
- We know that after the first toss, we will get two identical events, and after the second toss, the number of events will go to four.
- Thus, press 'Ctrl+D' six times to make a similar type of text box 6 times. Here, these text boxes are the nodes of the probability tree diagram.

- Now, rearrange them into 1, 2, and 4 in order and write down the following events.
- Next, we have to insert the branch. To insert them, again, go to the Insert tab.
- Then, click on the drop-down arrow of the Illustration > Shapes option and choose the Line Arrow shape.
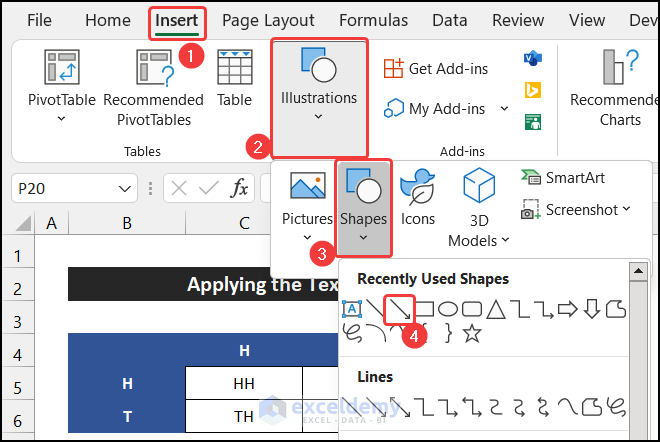
- Insert the Line Arrow shape as we insert the Text Box.

- In the end, place the arrow to make a relation among the nodes like in the image shown below.
- Afterward, format them according to your desire.
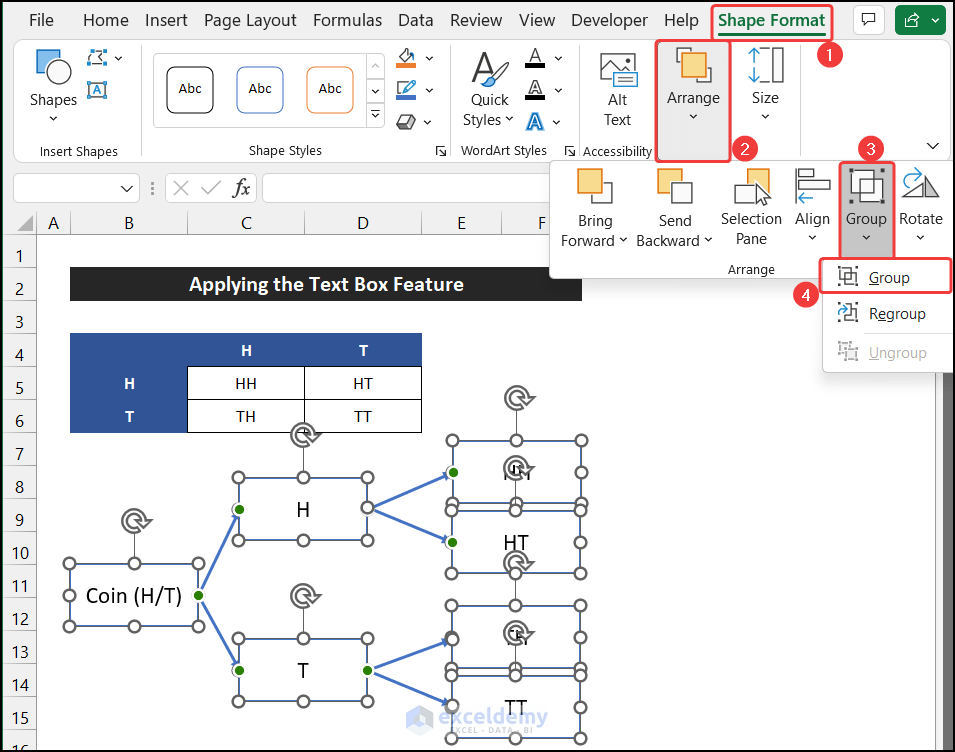
- In addition, select all the shapes and click on the drop-down arrow of the Group > Group option from the Arrange group, located in the Shape Format tab, to stop their accidental movement.
- Our probability tree diagram is ready.
Finally, we can say that our method works successfully, and we are able to make a probability tree diagram in Excel.
Conclusion
That's the end of this article. I hope that this article will be helpful for you and you will be able to make a probability tree diagram in Excel. Please share any further queries or recommendations with us in the comments section below if you have any further questions or recommendations.
Don't forget to check our website, ExcelDemy, for several Excel-related problems and solutions. Keep learning new methods and keep growing!
Source: https://www.exceldemy.com/how-to-make-a-probability-tree-diagram-in-excel/
0 Response to "how to draw a probability tree diagram in excel"
Post a Comment